"Hello from T!"Hello from T!Just like the previous, R-focused edition of this book, this one will not teach you about machine learning, statistics, or visualisation.
The goal is to teach you a set of tools, practices, and project management techniques that should make your projects easier to reproduce, replicate, and retrace, with a focus on polyglot (multilingual) projects. I believe that with LLMs, polyglot projects will become increasingly common.
Before LLMs, if you were a Python user, you would avoid R like the plague, and vice versa. This is understandable: even though both are high-level scripting languages, and an R user could likely read and understand Python code (and vice versa), it is still a pain in the ass to set up another language just to run a few lines of code. Now, with LLMs, you can have a model generate the code, and depending on what you’re doing, it’s very likely to be correct. However, setting up another language is still quite annoying. This is where Nix comes in. Nix makes adding another language to a project extremely simple.
You can now use several languages for a project: if you’re a Python user, you can now use R’s {ggplot2} quite easily by simply adding R and {ggplot2} to your project using Nix. However, in a way, this is just moving the goalposts: as annoying as it was to set up R and {ggplot2}, and no matter how effortlessly Nix solves this, now you need to set up Nix and get familiar with it!
But thankfully we live in the AI age, and LLMs can be quite helpful here. To make this even easier, we can combine Nix with T, a domain-specific language (DSL) designed specifically for building reproducible pipelines. My goal is for you not to have to worry (too much) about project setup, letting LLMs handle the heavy lifting. The way T is designed, is for LLMs to write T code, and you, together with an LLM if you wish to, are responsible for the R, Python or Julia code of your analysis.
Let me also show you alread what a reproducible analytical pipeline written in T looks like:
p = pipeline {
  -- 1. Load the data
  data = read_csv("datasets/country_level_data.csv")

  -- 2. Add a derived column in Python
  derived = pyn(
    command = <{
      derived = data.assign(
pct_change = data["average_price_m2_nominal_euros"].pct_change() * 100
      )
    }>,
    deserializer = ^ipc,
    serializer = ^ipc
  )

  -- 3. Plot the result in R
  plot = rn(
    command = <{
      library(ggplot2)
      plot <- ggplot(derived,
        aes(x = year, y = average_price_m2_nominal_euros)) +
        geom_line() +
        geom_point()
    }>,
    deserializer = ^ipc
  )
}

build_pipeline(p)
You don’t need to understand every line yet, just three things. First, p = pipeline { ... } declares a set of named steps (data, derived, plot), and nothing runs yet. Second, each step can run in a different language: here Python adds a column and R draws the plot, and T wires each step’s output into the next step’s input automatically, so you never write glue code. Third, build_pipeline(p) runs every step in dependency order and caches each step’s output, so rerunning the pipeline only rebuilds what changed. T comes with many features that make it easy for LLMs that have never seen T code to generate it flawlessly. It is also possible to load Python or R scripts instead of embedding the code directly in the T pipeline, which makes collaboration easier.
This book is for anyone who uses raw data to build any type of output. This could be a simple quarterly report, in which data is used for tables and graphs, a scientific article for a peer-reviewed journal, or even an interactive web application. The specific output doesn’t matter, because the process is, at its core, always very similar:
This book assumes some familiarity with programming, particularly with the R and Python languages. I will not discuss Julia in great detail, as I am not familiar enough with it to do it justice. That being said, I will show you how to add Julia to a project and use it effectively if you need to.
This book is also aimed at people that are not afraid to experiment with brand new tools and brand new ways of doing data science. I will talk about T, a new domain-specific language I started building from 2025 onwards that is built to be used by LLMs and humans alike. T is purpose-built for writing reproducible analytical pipelines (RAPs) in the age of LLMs.
The aim of this book is to make the process of analysing data as reliable, retraceable, and reproducible as possible, and to do this by design. This means that once you’re done with the analysis, you’re done. You don’t want to spend time, which you often don’t have anyway, rewriting or refactoring an analysis to make it reproducible after the fact. We both know this is not going to happen. Once an analysis is finished, it’s on to the next one. If you need to rerun an older analysis (for example, because the data has been updated), you’ll simply figure it out at that point, right? That’s a problem for Future You. Hopefully, Future You will remember every quirk of your code, know which script to run at which point, which comments are outdated, and what features of the data need to be checked… You had better hope Future You is a more diligent worker than you are!
Going forward, I’m going to refer to a project that is reproducible as a “Reproducible Analytical Pipeline”, or RAP for short. There are only two ways to create a RAP: either you are lucky enough to have someone on your team whose job is to turn your messy code into a RAP, or you do it yourself. The second option is by far the most common. The issue, as stated above, is that most of us simply don’t do it. We are always in a rush to get to the results and don’t think about making the process reproducible, because we assume it takes extra time that is better spent on the analysis itself. This is a misconception, for three reasons.
The first is that employing the techniques we will discuss in this book won’t actually take much time. As you will see, they are not things you “add on top of” the analysis, but are part of the analysis itself, and they will also help with managing the project. Some of these techniques, especially testing, will even save you time and headaches.
The second reason is that an analysis is never a one-shot. Only the simplest tasks, like pulling a single number from a database, might be. Even then, chances are that once you provide that number, you’ll be asked for a variation of it (for example, disaggregated by one or several variables). Or perhaps you’ll be asked for an update in six months. You will quickly learn to keep that SQL query in a script somewhere to ensure consistency. But what about more complex analyses? Is keeping the script enough? It is a good start, of course, but very often, there is no single script, or a script for each step of the analysis is missing.
The third reason is that we can actually offload so much of this to LLMs that there truly is no reason not to do it.
Of course, building a RAP is not just a technical challenge; it is also an organisational one. I’ve seen this play out many times in many different organisations. It’s that time of the year again, and a report needs to be written. Ten people are involved, and just gathering the data is already complicated. Some get their data from Word documents attached to emails, some from a website, some from a PDF report from another department. I remember a story a senior manager at my previous job used to tell: once, a client put out a call for a project that involved setting up a PDF scraper. They periodically needed data from another department that only came in PDFs. The manager asked what was, at least from our perspective, an obvious question: “Why can’t they send you the underlying data in a machine-readable format?” They had never thought to ask. So, my manager went to that department and talked to the people putting the PDF together. Their answer? “Well, we could send them the data in any format they want, but they’ve asked for the tables in a PDF.”
So the first, and probably most important, lesson here is: when starting to build a RAP, make sure you talk to all the people involved.
You should be comfortable with the command line. This book will not assume any particular Integrated Development Environment (IDE), so most of what I’ll show you will be done via the command line. That said, I will spend some time helping you set up a data science-focused IDE, Positron, to work seamlessly with this workflow. The command line may be over 50 years old, but it is not going anywhere. In fact, thanks to the rise of LLMs, it seems to be enjoying a resurgence. Since these models generate text, it is far simpler to ask one for a shell command to solve a problem than to have it produce detailed instructions on where to click in a graphical user interface (GUI). Knowing your way around the command line is also essential for working with modern data science infrastructure: continuous integration platforms, Docker, remote servers… they all live in the terminal. So, if you’re not at all familiar with the command line, you might need to brush up on the basics. Don’t worry, though; this isn’t a book about the intricacies of the Unix command line. The commands I’ll show you will be straightforward and directly applicable to the task at hand.
This means, however, that if you are using Windows (first of all, why? and second of all), you will have to set up Windows Subsystem for Linux (WSL). This is because there is no native Nix implementation for Windows, and so we need to run the Linux version through WSL. Don’t worry though, it’s not that hard, and you can then use an IDE from Windows to work with the environments managed by Nix in a seamless way. (But seriously, if you can, consider switching to Linux. How can you tolerate ads (ADS!) in the Start menu?).
Ideally, you should be comfortable with either R or Python. This book will assume that you have been using at least one of these languages for some projects and want to improve how you manage complex projects. You should know about packages and how to install them, have written some functions, understand loops, and have a basic knowledge of data structures like lists. While this is not a book on visualisation, we will be making some graphs as well.
Our aim is to write code that can be executed non-interactively. This is because a necessary condition for a workflow to be reproducible and to qualify as a RAP is for it to be executed by a machine, automatically, without any human intervention. This is the second lesson of building RAPs: there should be no human intervention needed to get the outputs once the RAP has started. If you achieve this, then your workflow is likely reproducible, or can at least be made so much more easily than if it required special manipulation by a human somewhere in the loop.
This is also, in part, why we will not be working in Jupyter notebooks. A notebook is a record of an interactive conversation with the computer; a reproducible pipeline is a plain-text description of a system. We return to this in Chapter 3.
A reproducible project means that it can be rerun by anyone at zero (or very minimal) cost. But there are different levels of reproducibility, which I will discuss in the next section. Let’s first outline the requirements that a project must meet to be considered a RAP.
Open source is a hard requirement for reproducibility. No ifs, ands, or buts. I’m not just talking about the code you wrote for your research paper or report; I’m talking about the entire ecosystem you used to write your code and build the workflow.
Is your code open? Good. Or is it at least available to others in your organisation, in a way that they could re-execute it if needed? Also good.
But is your code written in a proprietary program, like STATA, SAS, or MATLAB? Then your project is not reproducible. It doesn’t matter if the code is well-documented, well-written, and available on a version control system. The project is simply not reproducible. Why?
Because on a long enough time horizon, there is no way to re-execute your code with the exact same version of the proprietary language and operating system that were used when the project was developed. As I’m writing these lines, MATLAB, for example, is at version R2025a. Buying an older version may not be simple. I’m sure if you contact their sales department, they might be able to sell you an older version. Maybe you can even re-download older versions you’ve already purchased from their website. But maybe it’s not that straightforward. Or maybe they won’t offer this option in the future. In any case, if you search for “purchase old version of Matlab,” you will see that many researchers and engineers have this need. ::: {.content-hidden when-format=“pdf”}

:::
And if you’re running old code written for, say, version R2008a, there’s no guarantee that it will produce the exact same results on version R2025a. That’s without even mentioning the toolboxes (if you’re not familiar with them, they’re MATLAB’s equivalent of packages or libraries). These evolve as well, and there’s no guarantee that you can purchase older versions. It’s also likely that newer toolboxes cannot even run on older versions of MATLAB.
Let me be clear: what I’m describing here for MATLAB could also be said for any other proprietary program still commonly (and unfortunately) used in research and statistics, like STATA, SAS, or SPSS. Even if some of these vendors provide ways to run older versions of their software, the fact that you have to rely on them for this is a barrier to reproducibility. There is no guarantee they will provide this option forever. Who can guarantee that these companies will even be around forever? More likely, they might shift from a program you install on your machine to a subscription-based model.
For just 199€ a month, you can execute your SAS (or whatever) scripts on the cloud! Worried about data confidentiality? No problem, data is encrypted and stored safely on our secure servers! Run your analysis from anywhere and don’t worry about your cat knocking coffee over your laptop! And if you purchase the pro licence, for an additional 100€ a month, you can even execute your code in parallel!
Think this is science fiction? There is a growing and concerning trend for vendors to move to a Software-as-a-Service model with monthly subscriptions. It happened to Adobe’s design software, and the primary reason it hasn’t yet happened for data analytics tools is data privacy concerns. Once those are deemed “solved,” I would not be surprised to see a similar shift.
So where does that leave us? For a project to be truly reproducible, it has to satisfy the following requirements:

Let’s take one step back. We live in the real world, where constraints outside of our control can make it impossible to build a true RAP. Sometimes we need to settle for something that might not be perfect, but is the next best thing.
In what follows, let me assume the code is tested and documented, so we will only discuss the pipeline’s execution.
The least reproducible pipeline would be something that works, but only on your machine. This could be due to hardcoded paths that only exist on your laptop. Anyone wanting to rerun the pipeline would need to change them. This should be documented in a README, which we’ve assumed is the case. But perhaps the pipeline only runs on your laptop because the computational environment is hard to reproduce. Maybe you use software, even open-source software, that is not easy to install (anyone who has tried to install R packages on Linux that depend on {rJava} knows what I’m talking about).
A better, though still imperfect, pipeline would be one that could be run more easily on any similar machine. This could be achieved by avoiding hardcoded absolute paths and by providing instructions to set up the environment. For example, in Python, this could be as simple as providing a requirements.txt file that lists the project’s dependencies, which could be installed using pip:
pip install -r requirements.txtDoing this helps others (or Future You) install the required packages. However, this is not enough, as other software on your system, outside of what pip manages, can still impact the results.
You should also ensure that people run the same analysis on the same versions of R or Python that were used to create it. Just installing the right packages is not enough. The same code can produce different results on different versions of a language, or not run at all. If you’ve been using Python for some time, you certainly remember the switch from Python 2 to Python 3. Who knows, the switch to Python 4 might be just as painful!
The takeaway message is that relying on the language itself being stable over time is not a sufficient condition for reproducibility. We have to set up our code in a way that is explicitly reproducible by dealing with the versions of the language itself.
So what does this all mean? It means that reproducibility exists on a continuum. Depending on the constraints you face, your project can be “not very reproducible” or “totally reproducible”. Let’s consider the following list of factors that can influence how reproducible your project truly is:
By “reproducibility is on a continuum,” I mean that you can set up your project to take none, one, two, three, four, or all of the preceding items into consideration.
This is not a novel or new idea. Peng (2011) already discussed this concept but named it the reproducibility spectrum:
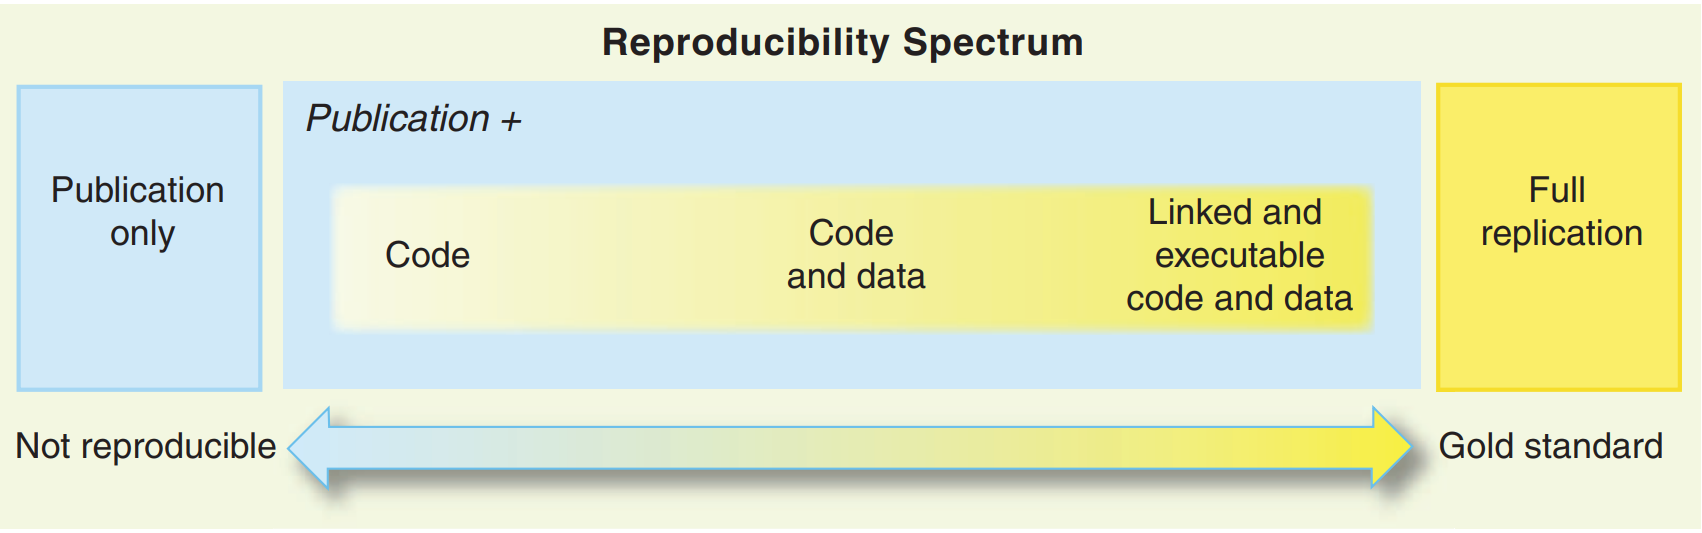
Notice, however, what the spectrum does not address: it is concerned entirely with the environment, whether the same packages and language version are available. It says nothing about whether the computation can actually be re-executed. A project can sit at the far right of Peng’s spectrum, with every dependency pinned and documented, and still be practically irreproducible because nobody can figure out which script to run first, in what order, and with what inputs. Environment reproducibility is necessary but not sufficient; you also need what we might call computational reproducibility: an explicit, runnable description of the pipeline itself, not just the software it runs on. We will return to this distinction in Chapter 4, where it becomes the central motivation for T’s mandatory pipeline architecture.
Let me finish this introduction by discussing the last item on the list: hardware architecture. In 2020, Apple changed the hardware architecture of their computers. Their new machines no longer use Intel CPUs, but instead Apple’s own proprietary architecture (Apple Silicon) based on the ARM specification. Concretely, this means that binary packages built for Intel-based Apple computers cannot run on their new machines, at least not without a compatibility layer. If you have a recent Apple Silicon Mac and need to install old packages to rerun a project (and we will learn how to do this), they need to be compiled to work on Apple Silicon first. While a compatibility layer called Rosetta 2 exists, my point is that you never know what might come in the future. The ability to compile from source is important because it requires the fewest dependencies outside of your control. Relying on pre-compiled binaries is not future-proof, which is another reason why open-source tools are a hard requirement for reproducibility.
For Windows users, don’t think that the preceding paragraph does not concern you. It is very likely that Microsoft will push for OEM manufacturers to build more ARM-based computers in the future. There is already an ARM version of Windows, and I believe Microsoft will continue to support it. This is because ARM is much more energy-efficient than other architectures, and any manufacturer can build its own ARM CPUs by purchasing a license, a very interesting proposition from a business perspective.
It is also possible that we will move towards more cloud-based computing, though I think this is less likely than the hardware shift. In that case, it is quite likely that the actual code will be running on Linux servers that are ARM-based, due to energy and licensing costs. Here again, if you want to run your historical code, you’ll have to compile old packages and programming language versions from source.
Okay, this might all seem incredibly complicated. How on earth are we supposed to manage all these risks and balance the immediate need for results with the future need to rerun an old project? And what if rerunning it is never needed?
As you shall see, this is not as difficult as it sounds, thanks to Nix, the tireless efforts of the nixpkgs maintainers who work to build truly reproducible packages, and T (which brings it all together into a clean, declarative pipeline).
Let’s dive in!
"Hello from T!"Hello from T!Over the next two chapters, we’ll unpack all of this and write our first pipeline from scratch.
https://github.com/numpy/numpy/issues/9187↩︎